Histograms
Histograms are
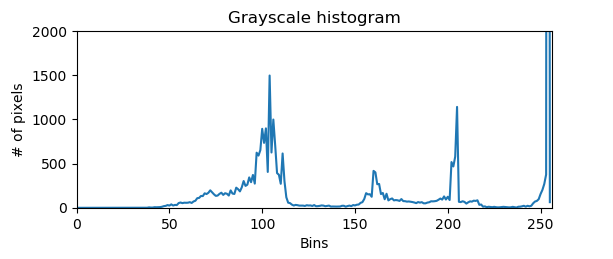
Grayscale histogram
The calcHist function takes these arguments:
cv.calcHist([img], channels, mask, bins, ranges)
- image list
- channel list
- mask
- the number of bins
- ranges, typically [0, 255]
from matplotlib import pyplot as plt
import cv2 as cv
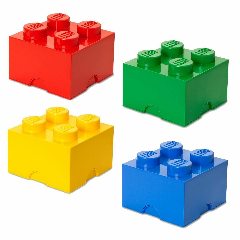
img = cv.imread('lego.png')
gray = cv.cvtColor(img, cv.COLOR_BGR2GRAY)
hist = cv.calcHist([gray], [0], None, [256], [0, 256])
plt.figure()
plt.title('Grayscale histogram')
plt.xlabel('Bins')
plt.ylabel('# of pixels')
plt.plot(hist)
plt.xlim([0, 256])
plt.ylim([0, 2000])
plt.show()
cv.waitKey(0)
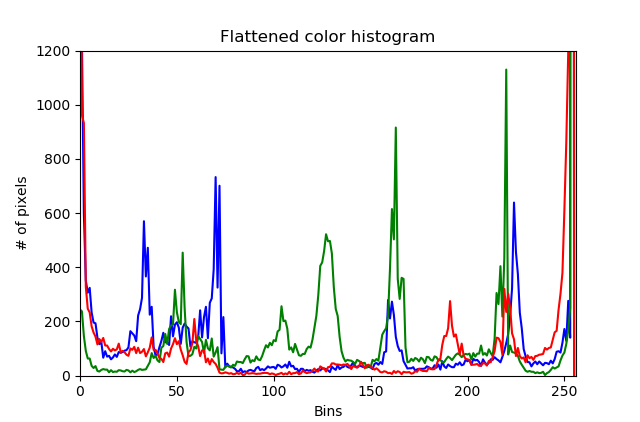
Color histogram
Here is the histogram
# Color histogram
from matplotlib import pyplot as plt
import cv2 as cv

img = cv.imread('lego.png')
chans = cv.split(img)
colors = 'b', 'g', 'r'

plt.figure()
plt.title('Flattened color histogram')
plt.xlabel('Bins')
plt.ylabel('# of pixels')

for (chan, color) in zip(chans, colors):
    hist = cv.calcHist([chan], [0], None, [256], [0, 255])
    plt.plot(hist, color=color)
    plt.xlim([0, 256])
    plt.ylim([0, 1200])

plt.show()
cv.waitKey(0)
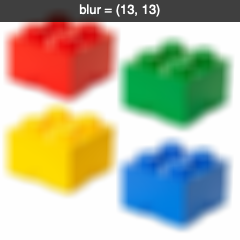
Blurring
# Blurring
import cv2 as cv

def trackbar(x):
    x = cv.getTrackbarPos('blur x','window')
    y = cv.getTrackbarPos('blur x','window')
    blurred = cv.blur(img, (x, y))
    cv.imshow('window', blurred)
    cv.displayOverlay('window', f'blur = ({x}, {y})')

img = cv.imread('lego.png')
cv.imshow('window', img)
cv.createTrackbar('blur x', 'window', 0, 4, trackbar)
cv.createTrackbar('blur y', 'window', 0, 4, trackbar)

cv.waitKey(0)
cv.destroyAllWindows()