Drawing shapes
OpenCV has different drawing functions to draw:
- lines
- circle
- rectangle
- ellipse
- text
Using Numpy
Numpy is a very powerful math module for dealing with multi-dimensional data such as vectors and images. The OpenCV images are represented as Numpy arrays. At the start of a program we import both:
import cv2 as cv
import numpy as np
To create an empty color image we create a 3D array of zeroes:
img = img = np.zeros((100, 600, 3), np.uint8)
cv.imshow('RGB', img)
When zooming, we can see the 3 color components.
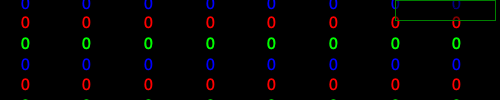
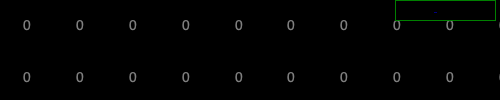
To create an empty gray-scale image we create a 2D array of zeroes:
gray_img = np.zeros((100, 600), np.uint8)
cv.imshow('Gray', gray_img)
The grayscale values for each pixel go from 0 to 255. In a black image all pixel values are 0.
import cv2 as cv
import numpy as np

img = img = np.zeros((100, 500, 3), np.uint8)
cv.imshow('RGB', img)

gray_img = np.zeros((100, 500), np.uint8)
cv.imshow('Gray', gray_img)

cv.waitKey(0)
cv.destroyAllWindows()
Define colors
Colors are defined by three base colors: Blue, Green and Red. All three put to zero gives black, all three at the maximum gives white:
BLACK = (0, 0, 0)
WHITE = (255, 255, 255)
Different from the more common RGB ordering, OpenCV uses the ordering BGR:
RED = (0, 0, 255)
GREEN = (0, 255, 0)
BLUE = (255, 0, 0)
Mixing color components results in more colors:
CYAN = (255, 255, 0)
MAGENTA = (255, 0, 255)
YELLOW = (0, 255, 255)
Draw a line
The function cv.line() adds a line to an image:
cv.line(image, p0, p1, color, thickness)
- image where the line is added
- start point p0
- end point p1
- line color
- line thickness
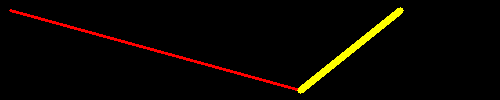
Lets define three points:
p0 = 10, 10
p1 = 300, 90
p2 = 500, 10
Now we can draw two colored lines:
cv.line(img, p0, p1, RED, 2)
cv.line(img, p1, p2, YELLOW, 5)
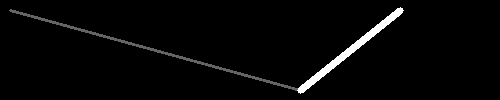
If the image is a gray-scale image, instead of the color triplet, a grayscale value from 0 (black) to 255 (white) is used:
cv.line(gray_img, p0, p1, 100, 2)
cv.line(gray_img, p1, p2, 255,5)
import cv2 as cv
import numpy as np

RED = (0, 0, 255)
YELLOW = (0, 255, 255)

p0, p1, p2 = (10, 10), (300, 90), (400, 10)

img = img = np.zeros((100, 500, 3), np.uint8)
cv.line(img, p0, p1, RED, 2)
cv.line(img, p1, p2, YELLOW, 5)
cv.imshow('RGB', img)

gray_img = np.zeros((100, 500), np.uint8)
cv.line(gray_img, p0, p1, 100, 2)
cv.line(gray_img, p1, p2, 255,5)
cv.imshow('Gray', gray_img)

cv.waitKey(0)
cv.destroyAllWindows()
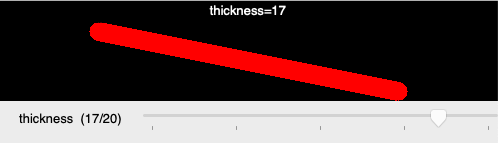
Select thickness with a trackbar
We can use a trackbar to set the thickness of the line.
The trackbar callback function has one argument - the line thickness.
Trackbar arguments are always integer and they always start at 0.
However, for lines the smallest line thickness is 1.
Therefore we use the max function to make the thickness at least 1.
To have a numeric feedback, we display the thickness value also in the overlay:
def trackbar(x):
    x = max(1, x)
    cv.displayOverlay('window', f'thickness={x}')
Next we have to redraw the line. We start by resetting the image to 0. Then we draw the line and display the new image:
img[:] = 0
cv.line(img, p0, p1, RED, x)
cv.imshow('window', img)
# Select line thickness with a trackbar
import cv2 as cv
import numpy as np

RED = (0, 0, 255)
p0, p1 = (100, 30), (400, 90)

def trackbar(x):
    x = max(1, x)
    cv.displayOverlay('window', f'thickness={x}')
    img[:] = 0
    cv.line(img, p0, p1, RED, x)
    cv.imshow('window', img)

img = np.zeros((100, 500, 3), np.uint8)
cv.line(img, p0, p1, RED, 2)
cv.imshow('window', img)
cv.createTrackbar('thickness', 'window', 2, 20, trackbar)

cv.waitKey(0)
cv.destroyAllWindows()
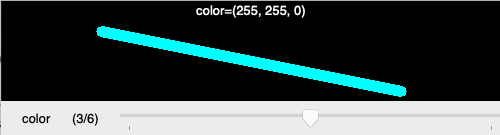
Select color with a trackbar
We can use a trackbar to set the line color. The trackbar is used to select an index into a color list which we define with 7 colors:
colors = (RED, GREEN, BLUE, CYAN, MAGENTA, YELLOW, WHITE)
The trackbar is defined to return an integer value from 0 to 6:
cv.createTrackbar('color', 'window', 0, 6, trackbar)
Inside the trackbar callback function we use the index to look up the color. To give numeric feedback we display the color RGB value in the overlay:
def trackbar(x):
    color = colors[x]
    cv.displayOverlay('window', f'color={color}')
# Select line color with a trackbar
import cv2 as cv
import numpy as np

RED = (0, 0, 255)
GREEN = (0, 255, 0)
BLUE = (255, 0, 0)
CYAN = (255, 255, 0)
MAGENTA = (255, 0, 255)
YELLOW = (0, 255, 255)
WHITE = (255, 255, 255)

colors = (RED, GREEN, BLUE, CYAN, MAGENTA, YELLOW, WHITE)
p0, p1 = (100, 30), (400, 90)

def trackbar(x):
    color = colors[x]
    cv.displayOverlay('window', f'color={color}')
    img[:] = 0
    cv.line(img, p0, p1, color, 10)
    cv.imshow('window', img)

img = np.zeros((100, 500, 3), np.uint8)
cv.line(img, p0, p1, RED, 10)
cv.imshow('window', img)
cv.createTrackbar('color', 'window', 0, 6, trackbar)

cv.waitKey(0)
cv.destroyAllWindows()
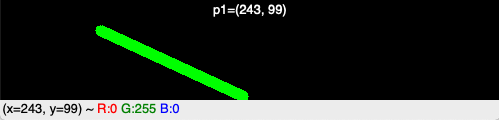
Select end point with the mouse
Let’s use the mouse for selecting the end point of the line. The mouse callback function has the x and y coordinates as arguments. We are only interesed in the mouse movement when a button is pressed (flags==1). The current mouse coordinates will be the new end point for the line. We display this coordinates in the overlay:
def mouse(event, x, y, flags, param):
    if flags == 1:
        p1 = x, y
        cv.displayOverlay('window', f'p1=({x}, {y})')
# Select end point with the mouse
import cv2 as cv
import numpy as np

GREEN = (0, 255, 0)
p0, p1 = (100, 30), (400, 90)

def mouse(event, x, y, flags, param):
    if flags == 1:
        p1 = x, y
        cv.displayOverlay('window', f'p1=({x}, {y})')
        img[:] = 0
        cv.line(img, p0, p1, GREEN, 10)
        cv.imshow('window', img)

img = np.zeros((100, 500, 3), np.uint8)
cv.line(img, p0, p1, GREEN, 10)
cv.imshow('window', img)
cv.setMouseCallback('window', mouse)

cv.waitKey(0)
cv.destroyAllWindows()
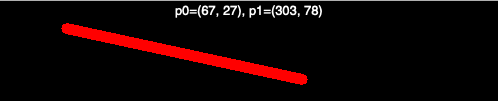
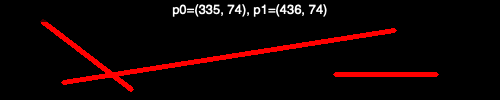
Draw a complete line
Let’s now draw a complete line with the mouse.
Now we need to distinguish between mouse down, mouse move and mouse up events.
When the mouse is down, we start a new line and set both points p0 and p1
to the current mouse position:
if event == cv.EVENT_LBUTTONDOWN:
     p0 = x, y
     p1 = x, y
If the mouse moves (with the button pressed) or if the mouse button goes up,
we only set p1 to the new mouse position:
elif event == cv.EVENT_MOUSEMOVE and flags == 1:
    p1 = x, y

elif event == cv.EVENT_LBUTTONUP:
    p1 = x, y
At the end of the mouse callback function we reset the image to zero (black), draw the line, display the new image and show the two points in the overlay:
img[:] = 0
cv.line(img, p0, p1, RED, 10)
cv.imshow('window', img)
cv.displayOverlay('window', f'p0={p0}, p1={p1}')
# Draw a complete line with the mouse
import cv2 as cv
import numpy as np

RED = (0, 0, 255)
p0, p1 = (100, 30), (400, 90)

def mouse(event, x, y, flags, param):
    global p0, p1

    if event == cv.EVENT_LBUTTONDOWN:
        p0 = x, y
        p1 = x, y

    elif event == cv.EVENT_MOUSEMOVE and flags == 1:
        p1 = x, y

    elif event == cv.EVENT_LBUTTONUP:
        p1 = x, y

    img[:] = 0
    cv.line(img, p0, p1, RED, 10)
    cv.imshow('window', img)
    cv.displayOverlay('window', f'p0={p0}, p1={p1}')

img = np.zeros((100, 500, 3), np.uint8)
cv.imshow('window', img)
cv.setMouseCallback('window', mouse)

cv.waitKey(0)
cv.destroyAllWindows()
Draw multiple lines
How do we do to draw multiple lines to an image?
First we need to have a temporary copy img0 which contains the lines
of the previous stage of the drawing:
img0 = np.zeros((100, 500, 3), np.uint8)
img = img0.copy()
When the mouse button is down, we set the two points p0 and p1
to the current mouse position:
if event == cv.EVENT_LBUTTONDOWN:
    p0 = x, y
    p1 = x, y
When the mouse moves, we reset the current image to the previous image img0
and draw a blue line of thickness 2:
elif event == cv.EVENT_MOUSEMOVE and flags == 1:
    p1 = x, y
    img[:] = img0
    cv.line(img, p0, p1, BLUE, 2)
When the mouse goes up, we reset the image to the previous image img0,
draw a red line of thickness 4, and save this new image as img0:
elif event == cv.EVENT_LBUTTONUP:
    img[:] = img0
    cv.line(img, p0, p1, RED, 4)
    img0[:] = img
# Draw multiple lines with the mouse
import cv2 as cv
import numpy as np

RED = (0, 0, 255)
BLUE = (255, 0, 0)
p0, p1 = (100, 30), (400, 90)

def mouse(event, x, y, flags, param):
    global p0, p1

    if event == cv.EVENT_LBUTTONDOWN:
        p0 = x, y
        p1 = x, y

    elif event == cv.EVENT_MOUSEMOVE and flags == 1:
        p1 = x, y
        img[:] = img0
        cv.line(img, p0, p1, BLUE, 2)

    elif event == cv.EVENT_LBUTTONUP:
        img[:] = img0
        cv.line(img, p0, p1, RED, 4)
        img0[:] = img

    cv.imshow('window', img)
    cv.displayOverlay('window', f'p0={p0}, p1={p1}')

img0 = np.zeros((100, 500, 3), np.uint8)
img = img0.copy()
cv.imshow('window', img)
cv.setMouseCallback('window', mouse)

cv.waitKey(0)
cv.destroyAllWindows()
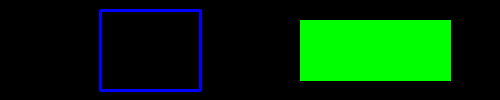
Draw a rectangle
The function cv.rectangle() adds a rectangle to an image:
cv.rectangle(image, p0, p1, color, thickness)
- image where the rectangle is added
- corner point p0
- corner point p1
- ouline color
- line thickness
If the line thickness is negative or cv.FILLED the rectangle is filled:
cv.rectangle(img, p0, p1, BLUE, 2)
cv.rectangle(img, p2, p3, GREEN, cv.FILLED)
import cv2 as cv
import numpy as np

BLACK = (0, 0, 0)
WHITE = (255, 255, 255)

RED = (0, 0, 255)
GREEN = (0, 255, 0)
BLUE = (255, 0, 0)

CYAN = (255, 255, 0)
MAGENTA = (255, 0, 255)
YELLOW = (0, 255, 255)

p0 = 100, 10
p1 = 200, 90
p2 = 300, 20
p3 = 450, 80

img = img = np.zeros((100, 500, 3), np.uint8)
cv.rectangle(img, p0, p1, BLUE, 2)
cv.rectangle(img, p2, p3, GREEN, cv.FILLED)
cv.imshow('RGB', img)

cv.waitKey(0)
cv.destroyAllWindows()
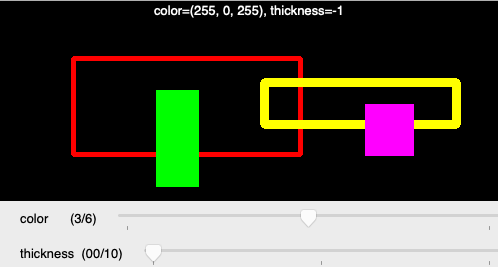
Draw multiple rectangles
Now we combine thickness and color trackbar as welle as the mouse callback to create multple rectangles.
import cv2 as cv
import numpy as np
from draw import *

def draw(x):
    global p0, p1
    d = cv.getTrackbarPos('thickness', 'window')
    d = -1 if d==0 else d
    i = cv.getTrackbarPos('color', 'window')
    color = colors[i]
    img[:] = img0
    cv.rectangle(img, p0, p1, color, d)
    cv.imshow('window', img)
    text = f'color={color}, thickness={d}'
    cv.displayOverlay('window', text)

def mouse(event, x, y, flags, param):
    global p0, p1
    if event == cv.EVENT_LBUTTONDOWN:
        img0[:] = img
        p0 = x, y
    elif event == cv.EVENT_MOUSEMOVE and flags == 1:
        p1 = x, y
    elif event == cv.EVENT_LBUTTONUP:
        p1 = x, y
    draw(0)

cv.setMouseCallback('window', mouse)
cv.createTrackbar('color', 'window', 0, 6, draw)
cv.createTrackbar('thickness', 'window', 0, 10, draw)

cv.waitKey(0)
cv.destroyAllWindows()
The common code such as color definitions and image creation has been placed in a separate file.
import numpy as np
import cv2 as cv

BLACK = (0, 0, 0)
WHITE = (255, 255, 255)

RED = (0, 0, 255)
GREEN = (0, 255, 0)
BLUE = (255, 0, 0)

CYAN = (255, 255, 0)
MAGENTA = (255, 0, 255)
YELLOW = (0, 255, 255)

colors = (RED, GREEN, BLUE, MAGENTA, CYAN, YELLOW, WHITE)
p0 = p1 = 0, 0

img0 = np.zeros((200, 500, 3), np.uint8)
img = img0.copy()
cv.imshow('window', img)
Draw an ellipse
The function cv.ellipes() adds an ellipse to an image:
cv.ellipse(img, center, axes, angle, a0, a1, color, thickness)
- image where the ellipse is added
- center point
- the two axes
- the axis orientation angle
- the beginning angle a0
- the ending angle a1
- ouline color
- line thickness

import cv2 as cv
import numpy as np

BLUE = (255, 0, 0)
center = 200, 50
axes = 100, 30
angle = 15

img = img = np.zeros((100, 500, 3), np.uint8)
cv.ellipse(img, center, axes, angle, 0, 360, BLUE, 2)
cv.imshow('RGB', img)

cv.waitKey(0)
cv.destroyAllWindows()
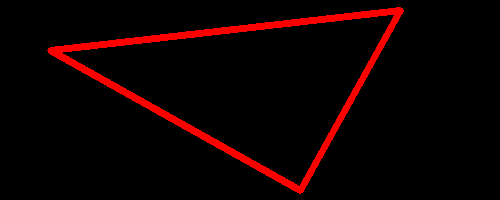
Draw a polygon
The polylines function expects a Numpy array for the point list:
pts = [(50, 50), (300, 190), (400, 10)]
cv.polylines(img, np.array([pts]), True, RED, 5)
import cv2 as cv
import numpy as np

RED = (0, 0, 255)
pts = [(50, 50), (300, 190), (400, 10)]

img = img = np.zeros((200, 500, 3), np.uint8)
cv.polylines(img, np.array([pts]), True, RED, 5)
cv.imshow('window', img)

cv.waitKey(0)
cv.destroyAllWindows()
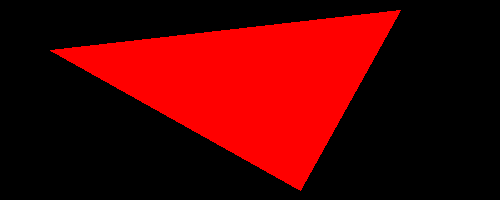
Draw a filled polygon
The polylines function expects a Numpy array for the point list:
pts = [(50, 50), (300, 190), (400, 10)]
cv.polylines(img, np.array([pts]), True, RED, 5)
import cv2 as cv
import numpy as np

RED = (0, 0, 255)
pts = [(50, 50), (300, 190), (400, 10)]

img = img = np.zeros((200, 500, 3), np.uint8)
cv.fillPoly(img, np.array([pts]), RED)
cv.imshow('window', img)

cv.waitKey(0)
cv.destroyAllWindows()
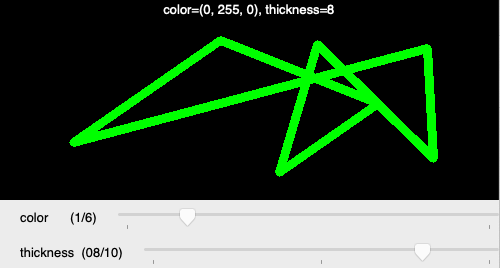
Draw a polygon with the mouse
Combining the previous techniques, it is rather simple to draw a polygon just by clicking into the window. First we define an empty list:
pts = []
Each time we click with the mouse we append a point:
def mouse(event, x, y, flags, param):
    if event == cv.EVENT_LBUTTONDOWN:
        pts.append((x, y))
        draw(0)
import cv2 as cv
import numpy as np
from draw import *

pts = []

def draw(x):
    d = cv.getTrackbarPos('thickness', 'window')
    d = -1 if d==0 else d
    i = cv.getTrackbarPos('color', 'window')
    color = colors[i]
    img[:] = img0
    cv.polylines(img, np.array([pts]), True, color, d)
    cv.imshow('window', img)
    text = f'color={color}, thickness={d}'
    cv.displayOverlay('window', text)

def mouse(event, x, y, flags, param):
    if event == cv.EVENT_LBUTTONDOWN:
        pts.append((x, y))
        draw(0)

cv.setMouseCallback('window', mouse)
cv.createTrackbar('color', 'window', 0, 6, draw)
cv.createTrackbar('thickness', 'window', 2, 10, draw)
draw(0)

cv.waitKey(0)
cv.destroyAllWindows()
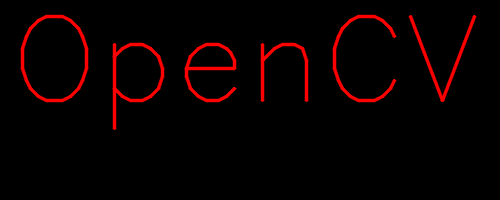
Draw text
import cv2 as cv
import numpy as np

RED = (0, 0, 255)
p0 = (10, 100)

font = cv.FONT_HERSHEY_SIMPLEX
img = np.zeros((200, 500, 3), np.uint8)
cv.putText(img,'OpenCV', p0, font, 4, RED, 2, cv.LINE_AA)
cv.imshow('window', img)

cv.waitKey(0)
cv.destroyAllWindows()
Reference: https://docs.opencv.org/4.2.0/d6/d6e/group__imgproc__draw.html